From easter egg to Christmas tree real quick ! #dataviz #science @graph_tool
From 1841, a fine example of the rapidly changing West and its sprawling territories. Shows the intended permanent Indian lands of the central plains, which wouldn't last a decade
Also a funny data visualization cheat. If you have a large "Unexplored Region" mask your ignorance by adding a distance chart.
Can AI erase the tedium of managing digital collections without also erasing what makes them distinctive? Find out in this recording of last month's webinar with Sara and Ben Brumfield of FromThePage, who explore the good, bad, and ugly of AI in archives.
https://digitalcuration.umaine.edu/teleconferences/dig_brumfield_teleconf_2025.html
@ned #dataviz #datavisualisation c’est parti pour rénover ma formation dataviz !
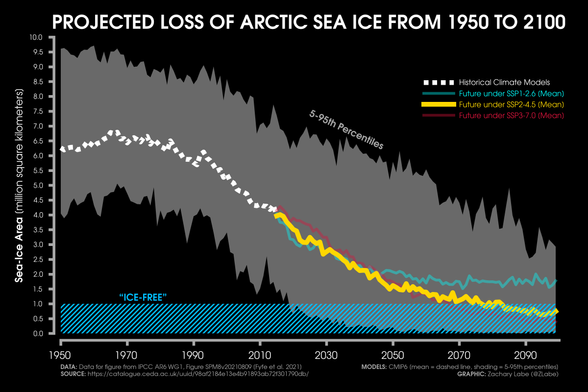
ICYMI - my first take on a timeline of global change. More at https://zacklabe.com/climate-viz-of-the-month/
It's the last day of the #30DayChartChallenge, and the final prompt is "National Geographic Theme" so here's my first and only map created for the challenge!
Made with #RStats
Colours inspired by National Geographic logo
{ggpattern} to use striped areas for missing data
This is amazing! #NeilHalloran, possibly my most favorite data storyteller on YouTube, has created another video about the eradication of #smallpox.
P.S. If you’re not familiar with his work, watch his World War II video.
“The fundamentals of data storytelling with John Burn-Murdoch”, chief data journalist at the Financial Times. First in a 3-part free webinar series from Flourish, May 14 10-11 am EDT.
https://www.eventbrite.co.uk/e/the-fundamentals-of-data-storytelling-with-john-burn-murdoch-tickets-1328295109429
#dataviz #ddj
World military spending hit a record $2.7 trillion in 2024, up 9.4% — the sharpest rise since 1988. Spending rose across all regions for the 2nd year running. Where does India stand, and what does this arms race mean for the global economy? Today's Number Theory explores this in detail.
Read on HT app: https://www.hindustantimes.com/editors-pick/understanding-global-military-expenditure-number-theory-101745894911408.html
#Defense #MilitarySpending #Military #SIPRI #US #China #Ukraine #India #Germany #Russia #DataViz @mastodonindians #MastIndia
Updated #CDC estimates show we'd pretty much been in a JN.1.11 soup since Dec, until late March, when LP.8.1 took majority.
Data collection continues to be a low priority nationally, as exactly zero regions have enough data for CDC to plot.
Two children of LF.7.7, dot1 and dot2, broken out by CDC, together with PA.1, a grandchild of MC.10.
Raj's dashboard was last updated a week ago today.
❖ #ThisIsOurPolio #Covid #Covid19 #SARS2 #variants #CovidIsNotOver #CovidIsAirborne #dataviz #datavis
Another #Quarto + #RStats + Observable combination for Day 27 of the #30DayChartChallenge
Two heatmaps to illustrate the prompt of "Noise" - unsorted heatmaps look like random noise, (sensibly) sorted heatmaps are more likely to reveal patterns!
«Dream of the Red Chamber» data visualizations of the three main protagonists along the 120 chapters of the novel
#dataviz #redology #hongloumeng
https://pmartinolli.github.io/HongLouMeng/ source and code available
Added a new convenience transducer for clipping and binning values, e.g. as preparation step for histogram generation whilst working in the REPL. New release forthcoming. A small code example attached (actually taken from the doc string of the new `binned()` transducer).
Réutiliser les données ouvertes afin d’obtenir une vue d’ensemble des ressources disponibles sur le portail FranceArchives : https://siaf.hypotheses.org/1710 #Archives @archivistodon #dataviz #DataLove #XML
I have learned so much about popes, cardinals, conclaves, antipopes, exploding popes, old popes, young popes this week. #dataViz https://www.nbcnews.com/data-graphics/pope-how-long-conclave-cardinals-papal-names-oldest-age-charts-rcna201635
2-year professorship in »Information Visualization & Management« (Oct 2025–Sep 2027, W2) at #FHPotsdam with focus on data visualization, urban complexity & interdisciplinary research.
This is my parental leave replacement - feel free to reach out to me or @boris if you have any questions.
Applications already due on 9 May!
Job ad: https://jobs.b-ite.com/jobposting/a595f8ac675dc069c3de5b1020f38f70cb6897a30?ref=homepage
(this is in German, but teaching can be in English!)
Some of my best work has, still, been barely noticed. Looking back, and reading my write up of my CitySounds, and umm...we need more work like this!
https://kristinhenry.medium.com/the-making-of-mycitysounds-a9757d59e3e4
It's Earth Day which reminded of this awesome little tool where you can write your name in beautiful satellite images
Happy Earth Day! Let's take care of it!
Your name in Landsat: https://landsat.gsfc.nasa.gov/apps/YourNameInLandsat-main/