Orhun Parmaksız 👾<p>A little update on my Guitar + Ratatui project 📢🎉</p><p>🎸 Now shows the realtime fretboard by connecting directly to your guitar.</p><p>⏳ Ignore the breadboard mess / PCB coming soon!</p><p>🦀 All powered by embedded Rust & <span class="h-card" translate="no"><a href="https://fosstodon.org/@ratatui_rs" class="u-url mention" rel="nofollow noopener" target="_blank">@<span>ratatui_rs</span></a></span></p><p>⭐ GitHub: <a href="https://github.com/orhun/tuitar" rel="nofollow noopener" translate="no" target="_blank"><span class="invisible">https://</span><span class="">github.com/orhun/tuitar</span><span class="invisible"></span></a></p><p><a href="https://fosstodon.org/tags/rustlang" class="mention hashtag" rel="nofollow noopener" target="_blank">#<span>rustlang</span></a> <a href="https://fosstodon.org/tags/ratatui" class="mention hashtag" rel="nofollow noopener" target="_blank">#<span>ratatui</span></a> <a href="https://fosstodon.org/tags/tui" class="mention hashtag" rel="nofollow noopener" target="_blank">#<span>tui</span></a> <a href="https://fosstodon.org/tags/embedded" class="mention hashtag" rel="nofollow noopener" target="_blank">#<span>embedded</span></a> <a href="https://fosstodon.org/tags/esp32" class="mention hashtag" rel="nofollow noopener" target="_blank">#<span>esp32</span></a> <a href="https://fosstodon.org/tags/fretboard" class="mention hashtag" rel="nofollow noopener" target="_blank">#<span>fretboard</span></a> <a href="https://fosstodon.org/tags/guitar" class="mention hashtag" rel="nofollow noopener" target="_blank">#<span>guitar</span></a> <a href="https://fosstodon.org/tags/visualization" class="mention hashtag" rel="nofollow noopener" target="_blank">#<span>visualization</span></a></p>
#visualization
1 post1 participant0 posts today

Cope and Drag — CnD — Lightweight Diagraming Language wins awards
“CnD’s design is driven by cognitive science principles that influence spatial reasoning, visualization, and diagramming. It combines this with a bottom-up analysis that distills patterns from dozens of actual custom visualizations, and finds the two come together nicely. The resulting language is small, uses minimal notation, and can be used incrementally.”
#BrownPLT #diagraming #visualization #OSS
https://cs.brown.edu/news/2025/07/16/brown-university-programming-languages-team-receives-ecoops-distinguished-paper-and-distinguished-artifact-awards/
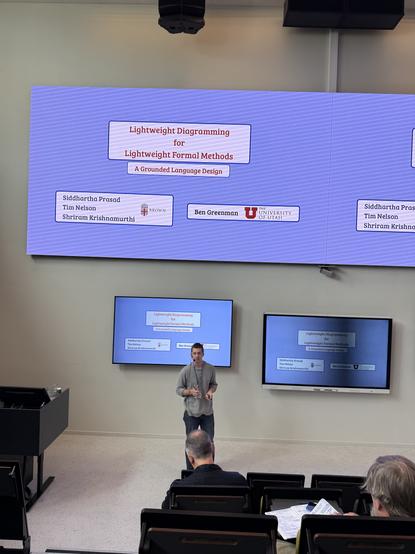
cs.brown.edu · Brown University Programming Languages Team Receives ECOOP’s Distinguished Paper And Distinguished Artifact AwardsNew work (Cope and Drag, also known as CnD) from Brown PLT is a novel lightweight diagramming language. It’s just earned recognition at ECOOP 2025, receiving both a Distinguished Paper and a Distinguished Artifact Award.

Ten years of running every day, visualized
no days offno days offA celebration of consistency, discipline, and the pursuit of movement


New embedded Rust milestone! 

 I connected my electric guitar to ESP32 with an amplifier circuit and visualized the played notes with @ratatui_rs
 Building this live: https://www.youtube.com/@orhundev/streams
 GitHub: https://github.com/orhun/tuitar
 Powered by mousefood: https://github.com/j-g00da/mousefood

Implement WCAG Rules in Your Infographics, by @a11ycollective:
https://www.a11y-collective.com/blog/accessible-infographics/
The A11Y Collective · Implement WCAG Rules in Your InfographicsCreate WCAG-compliant infographics with expert tips on alt text, contrast, and screen reader support. Make your visuals accessible to all.

There's a whole bunch of recent #ThingUmbrella updates which I still have to write about, but one of the things is the reworked, improved and more customizable optical flow (aka https://thi.ng/pixel-flow package). The visualization in this test video is showing it in action via color-coded overlaid flow field vectors (once again worst-case scenario for video compression, let's see how it comes out [or not...])

Just launched! The Real Image Height Comparison Tool from @Jushify.
Move beyond silhouettes and compare heights with actual photos for unparalleled accuracy. Upload your own pics or use our library. Great for creative projects, settling bets with friends, or just for fun.
Check it out! https://jushify.com/real-image-height-comparison-tool/


Chronometry / Horology
https://en.wikipedia.org/wiki/Chronometry
Mechanical Watch: Exploded View - Fredrik F. Ellertsen
https://fellerts.no/projects/epoch.html
https://news.ycombinator.com/item?id=44347425
Mechanical Watch – Bartosz Ciechanowski
https://ciechanow.ski/mechanical-watch/
en.wikipedia.orgChronometry - Wikipedia

Winamp's visualization plugins transformed music listening into a psychedelic art form, with community created plugins like MilkDrop generating real time fractal animations synchronized to audio frequencies that became as important as the music itself for many users. Ryan Geiss's MilkDrop used sophisticated mathematical algorithms to convert audio spectrum data into flowing, morphing visual experiences, spawning entire communities dedicated to creating and sharing visualization presets with names like "Flexi's Mindblender" and "Unchained's Particle Storm." The plugin architecture exposed deep audio analysis capabilities, allowing developers to create everything from simple oscilloscopes to complex 3D environments that responded to bass drops, tempo changes, and harmonic content in ways that made every song feel like a unique light show. When Geiss open sourced MilkDrop in 2005, it led to ProjectM, a cross platform implementation that has kept the visualization dream alive across Linux, Android, and modern media players like VLC and Kodi. Today's streaming services prioritize convenience over customization, but projects like ProjectM prove there's still a hunger for the deeply personal audio visual experiences that made Winamp feel like a digital synesthesia machine.
#Winamp #MilkDrop #ProjectM #visualization #opensource
#programming #visualization #consTrees #dataStructures #lisp #commonLisp #McCLIM https://screwlisp.small-web.org/clim/cons-tree-graphics/
A tiny bit of window dressing for the CLIM 2 spec's FORMAT-GRAPH-FROM-ROOTS. Which I use a lot because it is vanishingly little work, paste or type in some cons trees, voila, they merge matching symbols because I set that to happen, I can press a button to change the graphs, all great.
@jackdaniel (Thanks for McCLIM).
Replied in thread


 Yes, even statistics can be visualized using voxels…
Made in the early 2010s for the Dutch Emerce magazine.
Game-themed voxel …
https://graphics.social/@metin/110858474959620439

An accidental discovery: astronomers find a spiral structure in the Oort cloud by chance after data from a simulation were visualized in preparation of a new space show at the Hayden Planetarium
 news https://apnews.com/article/museum-planetarium-oort-cloud-b0050c65ebff830812b505cdd8c476ec research paper https://doi.org/10.3847/1538-4357/adbf9b
#ReleaseTuesday — New version of https://thi.ng/tsne with ~15-20% better performance[1] due to avoiding repeated internal allocations and skipping gradient updates where unnecessary...
[1] Benchmarked with multiple datasets of ~750 items, each with 192 dimensions (now ~165ms @ MBA M1, 2020)...
thi.ng/tsneHighly configurable t-SNE implementation for arbitrary dimensions
Continued thread

re: Medical stuff / MRI selfie

https://www.europesays.com/2106006/ Code Conversion, Reasoning, Visualization and Other LLMs for Science at Argonne – High-Performance Computing News Analysis #AI #AIForScience #ArgonneNationalLaboratory #ArtificialIntelligence #CodeConversion #Data #GenAI #GenrativeAI #HPCAI #LLMs #LLMsForScience #reasoning #Visualization
#programming #graphing #plotting #visualization #timeSeries #gnuplot #commonLisp #lisp #example https://screwlisp.small-web.org/programming/common-lisp-invoking-gnuplot/
I could not even find my own previous articles and #demos of this online!
I used #uiop run-program to handle one specific case like
(gnuplot "bad title" '((1 2) (3 4)) '((5 6) (7 8)))
or equivalently,
(apply 'gnuplot "bad title" '(((1 2) (3 4)) ((5 6) (7 8))))
Do you personally have an example? I remember it being hard to dredge up gnuplot examples but this is beyond silly.

Interesting look at how to present #data and why one method works better -
Scientists just found a way to break through climate apathy https://buff.ly/FGh7Hry
Grist · Scientists just found a way to break through climate apathy
Stunning new visualization from NASA’s Webb Telescope explores the Cosmic Cliffs, a spectacular ridge of dust clouds, sparkling with a myriad of stars, along the edge of the nebula Gum 31

About a month ago, I was nerdsniped by @joachim, and I set foot on an adventure inside of Wikidata, data processing, visualization, and more. Read on https://anisse.astier.eu/wikidata-communes-viewer.html
boitam.euJoachim (@joachim@boitam.eu)Combien de clics est-ce qu’il faut pour relier la page Wikipedia de Cerbère (Pyrénées Orientales) à Bray-Dunes (Nord), en ne cliquant que sur les liens présents dans le bloc “Communes limitrophes” ?
https://fr.wikipedia.org/wiki/Cerb%C3%A8re_(Pyr%C3%A9n%C3%A9es-Orientales)#:~:text=Communes%20limitrophes