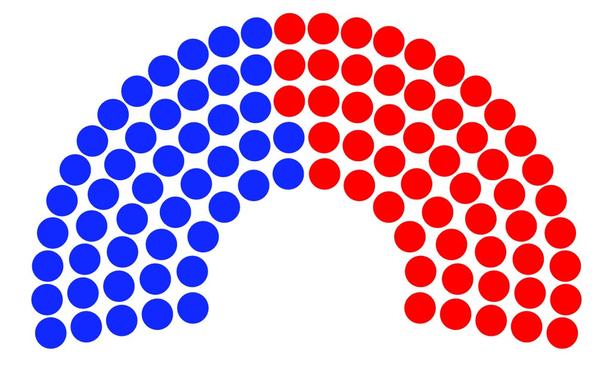
I covered the results of elections for the US Senate.
https://jasonbeets.blogspot.com/2025/01/republicans-win-senate-control.html
11/x

I covered the results of elections for the US Senate.
https://jasonbeets.blogspot.com/2025/01/republicans-win-senate-control.html
11/x

It's fun to learn how to create impactful #infographics & data-visuals. Discover how to create images like these at our next workshops
2 x virtual half days:
17th & 18th Jul USA timezone
15th & 16th Oct USA timezone
11th & 12th Nov UK/EU/AUS
Details: https://geni.us/WAB2024
Reviews: https://geni.us/WABreviews
Discounts available
Educational Infographics – Sharing Some Of The Work Of Zachary Ammerman
--
https://www.zacharyammerman.com/portfolio/infographics <-- shared infographic examples, including maps…
--
[I do not know Zachry personally or professionally, but these examples of his work are TOO dang good not to share ]
#GIS #spatial #mapping #alldataisspatial #cartography #education #infographics #FirstNation #history #ancienthistory #StoryOfAmerica #USHistory #K12 #schools #designer #NativeAmericans #mestizo #culture #migration #geography
@ZacharyAmmerman
Not just a global issue but a local one too. A local one... almost everywhere.
#note #oxford #climate #environmentalism #infographics #graphs
Elegant Structures: Federica Fragapane’s Award-Winning Infographics https://theinspirationgrid.com/elegant-structures-federica-fragapanes-award-winning-infographics/ #data #DataVisualization #infographics #InformationDesign #GraphicDesign #DesignInspiration #DesignInspo #inspiration #InspirationGrid
It's fun to learn how to create impactful #infographics & data-visuals. Discover how to create images like these at our next workshops
2 x virtual half days:
24th & 25th Jun UK/EU/AUS
17th & 18th Jul USA
Details: https://geni.us/WAB2024
Reviews: https://geni.us/WABreviews
Discounts available
Over 7000 people have enjoyed our fun workshops turning ideas, stories, numbers into impactful #infographics & data-visuals. Deets https://bit.ly/IIBWAB
Come join us!
2 x virtual half days:
24th & 25th Jun UK/EU/AUS
17th & 18th Jul USA
#Infographics: #GenerativeAI: 12 Graphs That Explain the State of AI in 2025
The United States may still have a commanding lead on the quantity of notable models released, but Chinese models are catching up on quality.
Stanford’s AI Index tracks performance, investment, public opinion, and more.
it’s a good thing I have some empty walls, cuz these music maps are my jam.
Water Data Keep Us Strong | USGS WaterAlert Water Safety at Your Fingertips [USGS Water]
--
https://www.usgs.gov/media/images/water-data-keep-us-strong and https://www.usgs.gov/media/images/usgs-wateralert-water-safety-your-fingertips <-- shared pair of USGS water-related infographics
--
https://accounts.waterdata.usgs.gov/wateralert/ <-- shared link to subscribe to USGS Water Alert
--
#water #hydrology #fedservice #fedscience #watersecurity #infographics #infographic #opendata #data #GIS #spatial #mapping #US #USA #alert #risk #hazard #monitoring #notification #waterdata #usecase #farms #agriculture #businesses #industry #residential #cost #economics #vitalresource #damage #assesr #resource #energy #HEP #watersupply #waterresources #management #planning #education #awareness #national #nation #WaterAlert #alerts #flows #streamflow #river #streamgauge #notification
@USGS
It's fun to learn how to create impactful #infographics & data-visuals. Discover how to create images like these at our next workshops
2 x virtual half days:
24th & 25th Jun UK/EU/AUS
17th & 18th Jul USA
Details: https://geni.us/WAB2024
Reviews: https://geni.us/WABreviews
Discounts available
Learn how to turn ideas, stories, numbers into impactful #infographics & data-visuals with Information is Beautiful. Details: https://bit.ly/IIBWAB
2 x virtual half days:
24th & 25th Jun UK/EU/AUS
17th & 18th Jul USA
Reviews: https://geni.us/WABreviews
#UnitedStates, #Canada, and #Europe account 52% of #global #GDP with only 14% of the #world #population
Share of #global #electricity demand in 2024
99 Maps to Save the Planet by Katapult, 2021
A shocking but informative, eye-catching and witty book of maps that illustrate the perilous state of our planet.
The maps in this book are often shocking, sometimes amusing, and packed with essential information.
@bookstodon
#books
#nonfiction
#environment
#maps
#infographics
@ChrisMayLA6 The gender gap is a real problem, but nobody should draw a bar chart like this.
Never cut the y-axis of the bar chart!
The point of a bar chart is to illustrate the relative sizes. Cutting the y-axis like this is simply lying.
Information about gender gap is too important to be ruined like this!
It seems that some people still don't get how tariffs works, so I made this silly thing to visually understand it. I make this "things" just for pleasure and to keep the design neurone active. It is a silly chart, no hidden intentions. #infographics #tariff #graphic (Note: you can change the flags to any other countries, it works the same)
Edit: In step one, where it says ‘to a foreign...’ it should read ‘from a foreign...’ damn my broken English!